Key Driver Analysis
Key Driver Analysis allows analysts to explore the relationship between an outcome (as measured on some metric such as satisfaction or purchase intent) and the hypothesized drivers of that outcome. Key Driver Analysis can help:
•A retailer understand how elements of a store visit predict shopper satisfaction with that visit.
•An internet retailer determine how aspects of a product listing predict purchase likelihood.
•An employer understand how employee satisfaction with each current benefit impacts overall employee satisfaction.
In each of these situations, the researcher has an outcome (Dependent Variable) that can be measured on a metric scale (i.e. an interval or ratio scale), and multiple potential influencers of that outcome (Independent Variables) that can also be measured on metric scales. Modeling the two together can provide important insights into how people evaluate experiences, goods, or services, and how you can influence that outcome the next time they interact with your company.
Note: We assume with driver analysis that the researcher has correctly identified the cause-and-effect relations between variables, because the model itself cannot distinguish causality from correlation.
Data Requirements
The program supports four different types of data:
Dependent Variable (Required)
A single general question that provides a value measurement for your key predictor of interest. For example, suppose a Super Hero was interested in finding out how to boost their engagement with the people they save. The first question might ask: Overall, how would you rate your Super Hero experience today? 0 – 10
The question can be a single numeric question, a single select question with a scale, or any other type of question that allows you to collect a metric measure of satisfaction.
Independent Variables (2 or more Required)
Questions asking respondents to rate their experience with respect to the potential drivers of the metric measured in Question 1. In our Super Hero example, we might ask, How satisfied were you with:
oAbility of Super Hero to completely save your day?
oPhoto opportunities with your Super Hero after the action was completed?
oThe amount of damage done to your city?
oThe variety of cool moves deployed by your Super Hero?
In Lighthouse Studio, we recommend asking these questions as Grid Questions, but other question types can be deployed for this as well.
Demographic / Segment Data (Optional)
Often we wish to segment the driver analysis by demographics to determine if segments of respondents have different drivers of their satisfaction. This data is typically categorical in nature and is not used as part of the Key Driver Analysis model itself.
Weighting Data (Optional)
If you wish to weight respondents in your analysis, you may collect or import a weighting variable. When the analysis is run, the weighting variable will allow you to place more or less emphasis on each respondent's answers to account for over/under sampling, purchase frequency, etc. Each analysis setup allows just one weighting variable to be applied. If a weighting variable is not provided, the algorithm will weight each respondent equally.
Note: Lighthouse Studio allows you to "stack" data as well (such as when respondents rate multiple brands on the dependent and independent variables), allowing you to create or import multiple sets of dependent and independent variables which, when stacked, allow you to create a model of the overall market drivers across different brands, occasions, etc. (or brand-specific occasion-specific key driver models). With Stacked Key Driver Analysis, the dependent and independent variables measured would need to be comparable in wording and ordering in the data set.
Key Driver Analysis can use data from any source if it is formatted correctly and of the correct data type. You can program a survey directly in Lighthouse Studio to collect this data, or you can import data from another source directly without having to create an entire questionnaire.
Sample Size Requirements
At a statistical bare minimum, Key Driver Analysis requires that you have at least one more set of respondent observations than you have independent variables in your model. If you have 12 drivers to explain guest satisfaction, you will need at least 13 respondents to rate all 12 items to build a model with zero degrees of freedom. We support the standard recommendation of having at least 10x as many cases as independent variables for each separately reportable subgroup (i.e., if you plan to run analysis by eight individual segments, then each should contain at least 10x as many cases as independent variables.
If you don't yet have real data, You can use the menu option Test > Generate Data to create random respondent data to allow you to set up and experiment with Key Driver Analysis. After it generates data, remember to click the Download Data option to move the data to your local project database. Of course, you can use real gathered data as well, as long as the survey you used to gather the data has both requirements listed above.
Running Key Driver Analysis
Once you have questions set up and have gathered data, you’ll need to create your analysis in Lighthouse Studio.
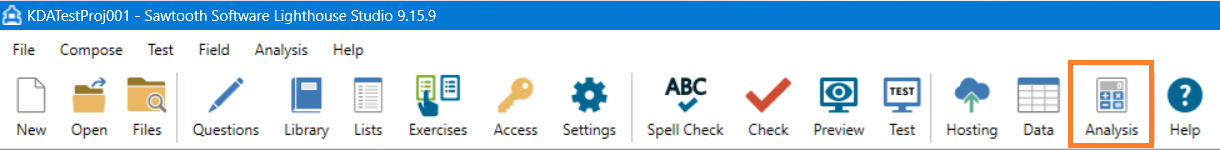
To begin, click the Analysis button in the main toolbar. If the Analysis button is not there or does not respond, you may not have data downloaded to your local project database.
Click Add, and select Key Driver Analysis.
Click the Gear icon to the right of the Analysis Type drop-down box. This brings up the Key Driver Analysis Settings dialog box, which has five tabs on the left side:
Variables Tab - Key Driver Analysis
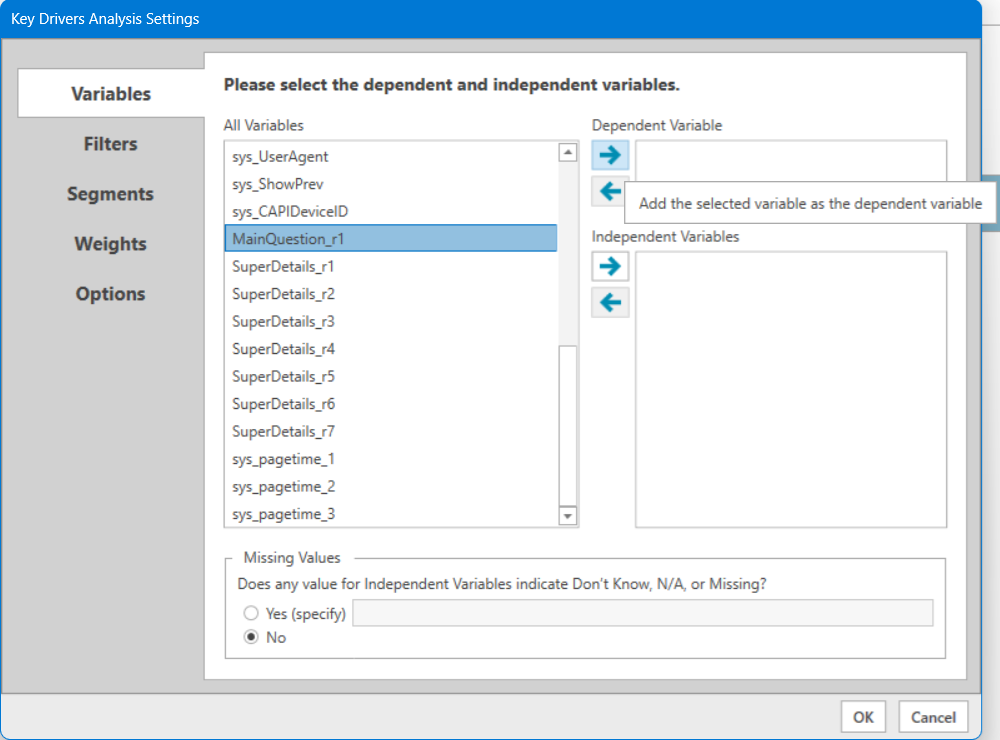
Begin with the Variables tab, where you need to specify your Dependent (overall outcome) and Independent (Drivers of outcome) Variables. Highlight the variable you wish to use as your dependent variable from the left side's "All Variables" selection window. Click the top arrow to add it as your dependent variable.
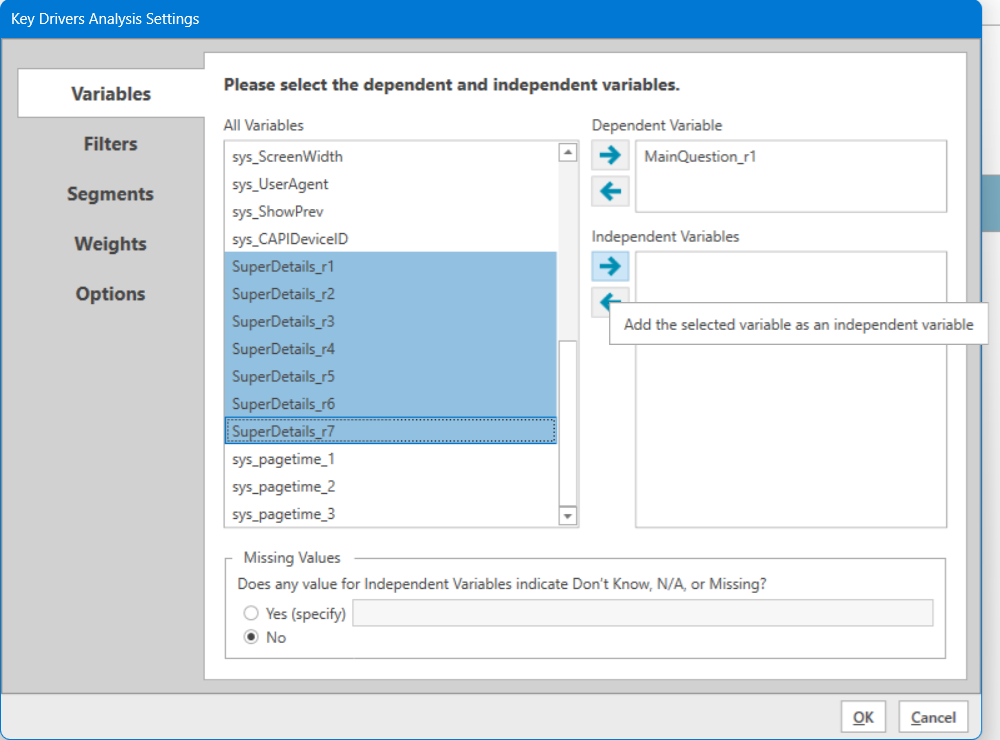
In the case below, the Dependent Variable is MainQuestion_r1 (our first question, row 1), and our Independent Variables are SuperDetails_r1 through SuperDetails_r7.
Now repeat this process, clicking the lower right-pointing arrow to select your independent variables. To select more than one variable at a time, click the first variable and hold the SHIFT key while clicking the last variable to select all variables in between, then click the right arrow button to add them all as independent variables. If you make a mistake, select the variable you need to remove and click the left arrow to move it back to the "All Variables" list. Variables on the right can only be moved back to the main list one at a time.
Missing Values
Occasionally, researchers will have an option in their response list (or their data coding) that represents a "Not Applicable" option. This is useful in situations where some of the drivers may not apply to all respondents. If the Independent Variables have a non-continuous option (such as "none", "N/A", "did not use this service"), select “Yes” in the Missing Values section at the bottom of the Variables screen, then enter the value that represents the non-continuous option. So if you had a 1-5 scale from Strongly Disagree to Strongly Agree, with option 6 being "Did not use this service", you would enter a 6 in the "Missing Values" space, and the software would treat it as if it were blank rather than as an extreme value beyond your 5-point scale.
Note: Only one missing value may be entered here, but that blanks are also automatically treated as missing values.
Variables - Stacked Key Driver
As with regular Key Driver Analysis, we begin with the Variables tab, where you need to specify your Dependent (overall outcome) and Independent (drivers of outcome) variables for each dataset you wish to stack. There are several options to add variables to these settings.
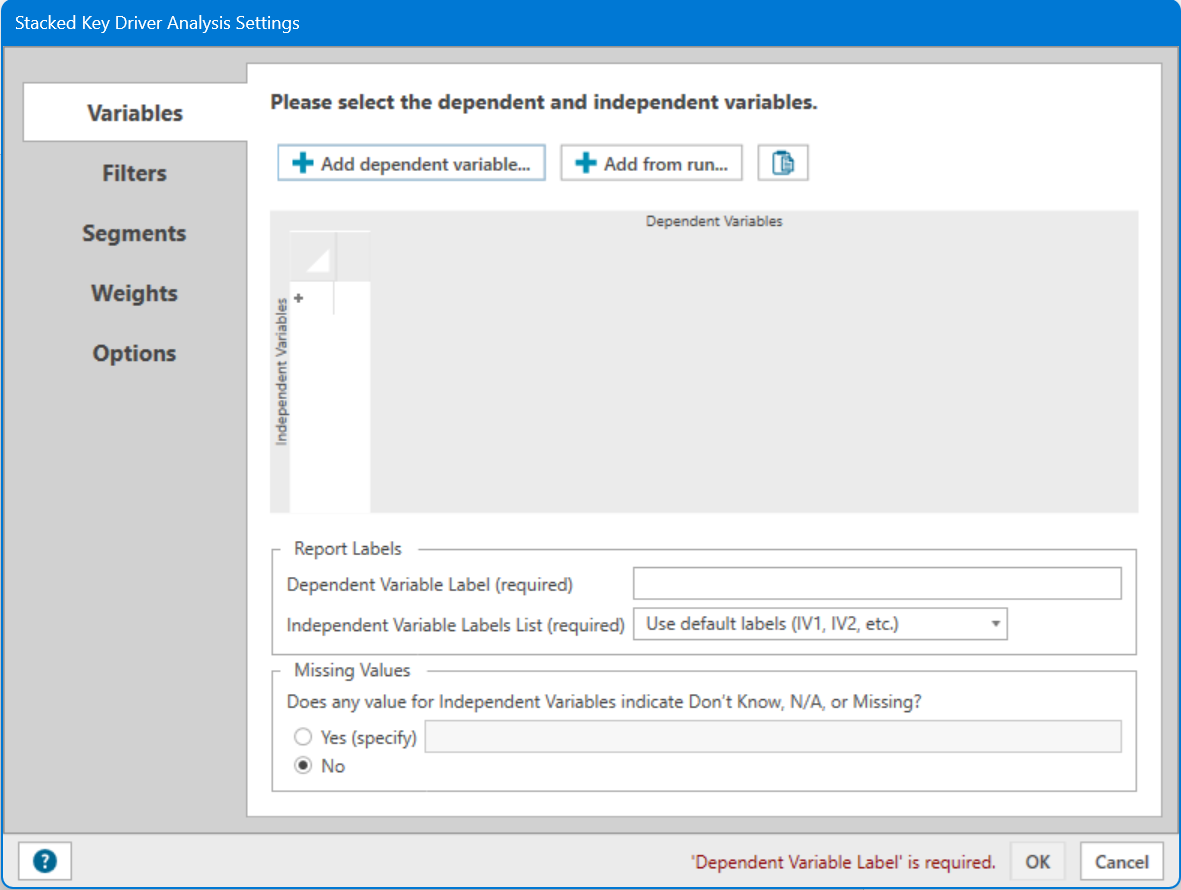
How you Add Dependent Variables in Stacked Key Driver is a little different. Note: Stacked Key Driver Analysis has multiple variable names feeding into each variable, so you will need to specify the Dependent Variable name for reporting purposes.
To add Dependent Variables directly:
Click the Add Dependent Variable button
Add dependent variable brings up this window.
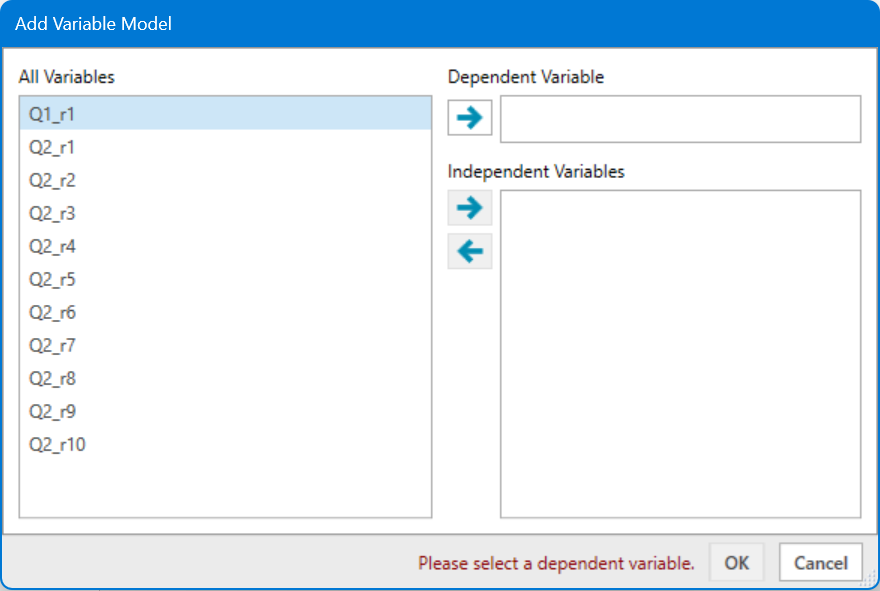
Highlight the variable you wish to use as the dependent variable for your first brand. Click the top arrow to add it as your first dependent variable. Select the independent variables for that brand and click the lower right-pointing arrow to add your independent variables. Repeat this process for each brand.
If you have already created standard Key Driver Analysis runs for your brands:
Click the Add from run button. Select the Key Driver Analysis setup(s) you wish to add to the stack, then click OK.
If you have a large number of sets to add:
You can use an external program like Excel to create the variable names for your dependent and independent variables. Select the variable names in your spreadsheet and click copy. Then in the Stacked Key Driver Analysis settings, click the Clipboard icon to paste them into the settings. If your variable names do not match variables in your data file, you will get an error message and will need to change the settings manually or fix the error and copy and paste again.
Filters Tab - Both
The Filters tab allows you to analyze just a subset of the total data. By default, Lighthouse Studio includes filters for Incomplete, Disqualified, and Complete surveys taken online or through CAPI. If you have added your own filters, they will be selectable here as well. If no filter is selected, Analysis will include all respondents. To add additional filters, exit out of the Analysis area to the main program window. Select Analysis from the top menu tab list and select "Filters". Once you have added the filters you need, come back to this area and select your desired filter.
Segments Tab - Both
The Segments tab allows you to compute separate models for each segment of your data. To use this you must have additional categorical variables in your dataset beyond your dependent and independent variables. When you turn on segmentation, the software will run one model per category within that variable, plus an additional model with all respondents. Please ensure that you have enough sample within each category to achieve stable results.
Weights Tab - Both
The Weights tab allows you to select a single variable to use as the Respondent Weight. Analysis > Create New Segments allows you to define formulas for weights (like Male = 1.25 Female = 0.75). When weighting is applied, respondents with higher weights will have more impact on the results, while respondents with lower weights will have less impact. The analysis spreadsheet will report a total sample size and a weighted sample size.
Options Tab - Key Driver Analysis
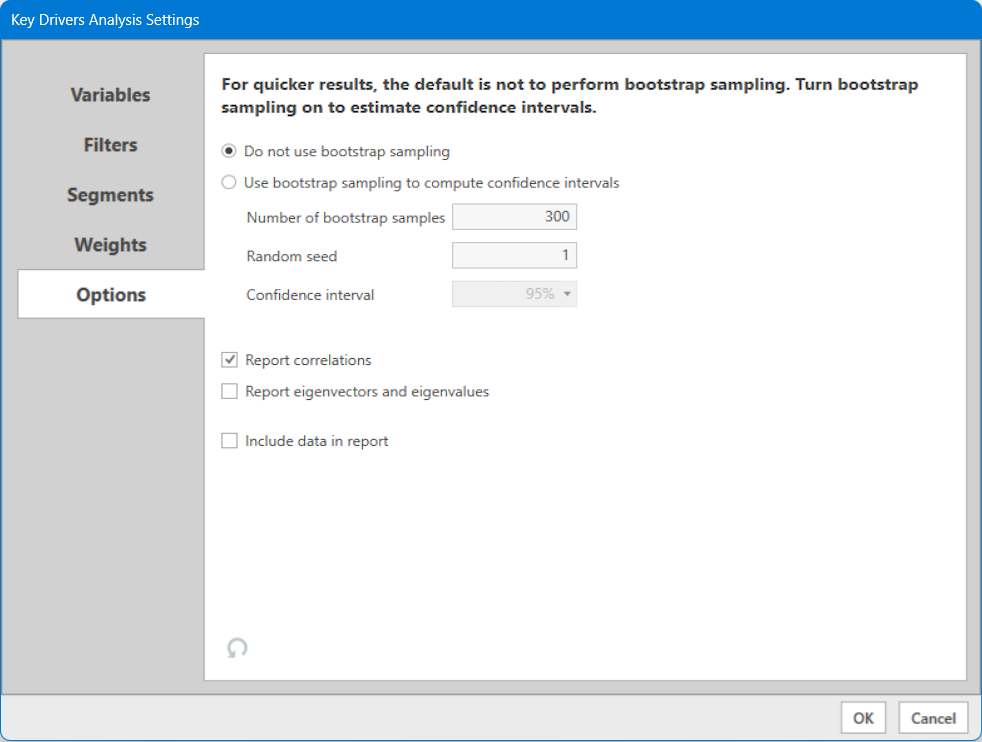
Bootstrap Sampling
When using Key Driver Analysis, Bootstrap Sampling is included as a tool to compute Confidence Intervals, which normally are not a product of the analysis since the model is deterministic. If you need to include confidence intervals when reporting your data, please turn on Bootstrap Sampling. In all other cases Bootstrap Sampling should probably not be used, as it slows down the analysis.
Note: When reporting results, the bootstrap sampling is only used to report the confidence intervals. All other results are based on the standard Key Drivers Analysis procedure without bootstrapping.
Report Correlations
Report Eigenvectors and Eigenvalues
If selected, these two settings write out various statistics to help determine appropriate model structure. More help on these can be found in the Key Driver Analysis Reporting section of the help.
Include Data in Report
If selected, the respondent data (DV and IV values) used in this model are written to the results in the Data tab. This can be useful for diagnostic testing and comparison with results from other packages. If you have specified a "Missing Values" indicator, these values are coded as "N/A" in the file. Weighting and segmentation variables are not applied, but any filters in place will remove respondents from this report. The data report is not available for bootstrap samples or stacked models.
Options Tab - Stacked Key Driver
Stacked Key Driver Analysis provides a convenient way to run individual models in addition to your stacked analysis. If you want to compute the individual driver analysis for each brand, select the "Run individual models in stack (in addition to the stacked model)" option at the top of the page. This option is only available for Stacked Key Driver Analysis.
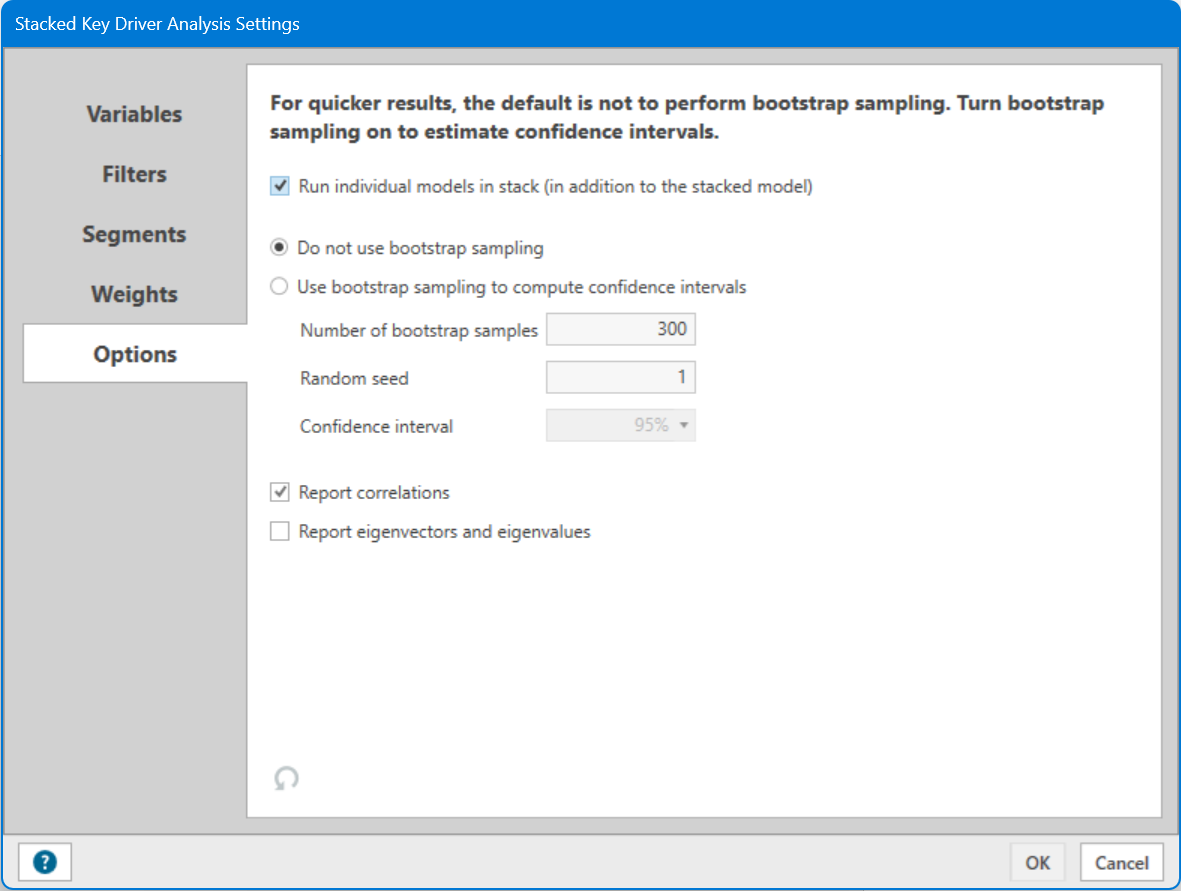
All other settings are the same as standard Key Driver Analysis setup.