Anchored MaxDiff
Respondents indicate which items are relatively better (or worse) than others within standard MaxDiff questionnaires. Thus, the scores are estimated on a relative scale, without any indication that the items are good or bad, important or unimportant, in an absolute sense. Some researchers have viewed that as a limitation for certain studies and certain clients.
Anchored MaxDiff lets the researcher draw a line (a utility boundary) between important and unimportant items (positive vs. negative impact, buy or no-buy, etc.). That utility boundary, for example, could be set at 0. Thus, any items that are positive are considered important and those that are negative are not important (in an absolute sense). Anchored MaxDiff score estimation is available for aggregate logit, latent class, and HB score estimation routines within Lighthouse Studio.
Anchored MaxDiff provides potentially more information than standard MaxDiff, but it comes at a cost. One of the key benefits of standard MaxDiff is that it is free from yea-saying or nay-saying bias, making it a very nice technique for studying relative preferences across countries or across respondents who have different scale use bias tendencies.
•With anchored MaxDiff, although a rating scale is not being used, the tendency for one group of respondents to generally be more positive/agreeable than another group of respondents can lead to similar problems as scale use bias, which was one of the main problems researchers have wanted to eliminate by using MaxDiff!
•Furthermore, using anchored MaxDiff scores within cluster segmentation (or latent class segmentation) might lead to respondent groups that are being delineated as much by their tendency to be positive/agreeable regarding the position of items vs. the anchor as by their relative scores for the items of interest within your study. (An obvious solution to this second issue is to develop the segmentation using un-anchored scores, but then to profile the segments using the anchored scores.)
Dual-Response Indirect Method
Jordan Louviere, the inventor of MaxDiff scaling, proposed a dual-response, indirect method for scaling the items relative to a threshold anchor of importance or desirability. You may add indirect scaling questions to your MaxDiff survey by clicking the Add Dual-Response Question box from the Format tab within your MaxDiff exercise. Below each MaxDiff question, a second (hence, "dual") question is inserted, such as the following:
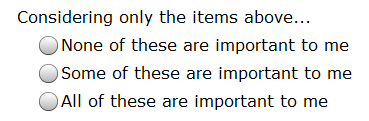
•If the respondent clicks "None of these are important to me" then we inform utility estimation that all four items shown in this MaxDiff set should have lower utility than the anchor threshold. The answer is coded in the data file as "3".
•If the respondent clicks "Some of these are important to me" then we know that the "best" item selected within the MaxDiff set should have higher utility than the anchor and the "worst" item selected should have lower utility than the anchor. The answer is coded in the data file as "2".
•If the respondent clicks "All of these are important to me" then we inform utility estimation that all four items should have higher utility than the anchor threshold. the answer is coded in the data file as "1".
When "Some of these are important to me" is selected, we know that the best item is better than the anchor and the worst item is worse than the anchor, but we do not have any information about how the two non-selected items (from this set of four) relate to the anchor. Thus, the dual-response indirect method provides incomplete information about how each of the items shown in a MaxDiff set relates to the anchor.
Note: if the dual-response indirect method is applied to questions that show just two items per set (paired comparisons questions), then we achieve complete information regarding how the two items shown relate to the anchor.
The indirect method should probably not be used with more than 4 items shown per set. Increasing the number of items per set increases the likelihood that respondents will select "Some of these are important to me," which provides incomplete information. Because of this issue, the software issues a warning if you try to use the indirect method with more than 4 items displayed per MaxDiff set.
The indirect method works well in practice. Evidence has been presented at the Sawtooth Software Conference that the indirect method tends to lead to more items being scaled above the anchor threshold than the direct method. In other words, the indirect method leads to more items being judged as "Important" or a "Buy" compared to the direct method (described directly below).
Both Bryan Orme (in 2009 at the SKIM/Sawtooth Software European Conference) and Kevin Lattery (at the 2010 Sawtooth Software Conference) have demonstrated how standard ratings questions (or sorting tasks) may be used to anchor MaxDiff items. Lattery's work is more generally referenced today, as his paper is more complete in comparing direct and indirect anchoring methods. Using questions outside the MaxDiff section, we may ask respondents directly whether each item (or each of a subset of the items) is important or not. A 2-point scale could be used, or respondents could be asked to sort items into two buckets: important and unimportant buckets. A 5-point scale could also be used, where items rated either top box or top-two box could signal that these exceed the importance threshold boundary, etc.
The direct method is quite flexible. To use it, you simply add the type of rating or sorting task you wish anywhere within your Lighthouse survey, referencing the same list of items you are using in your MaxDiff exercise. Later, during score estimation (under the Analysis menu), you indicate that you wish to use the Direct Binary Anchoring method and then specify the logic that references the scaling questions and communicates which value(s) on the scale indicate that each item exceeds the anchor threshold.
Examples:
•If you used a 2-point ratings question within a grid question called ImpItems to rate each of the items, then item 1 would exceed the anchor threshold if ImpItems_r1 > 1. ( _r1 stores the rating for the first row within a ratings grid.) If a respondent has missing data on the scaling question for an item, then no information is added for utility estimation regarding this item relative to the anchor for this respondent.
•If you used a multi-select checkbox called ImpItems, where respondents clicked which items on the list exceed the anchor threshold, then item 1 would exceed the anchor threshold if ImpItems_1=True. ( _1 stores the selection for the first item within a multi-select question.) If a respondent has missing data on the item (e.g., the item was not included on the constructed list), then no information is added for utility estimation regarding this missing item relative to the anchor for this respondent.
The direct method works well in practice. Evidence has been presented at the Sawtooth Software Conference that the direct method tends to lead to more items being scaled below the anchor threshold than the indirect method. In other words, the direct method leads to more items being judged as "Not Important" or a "No buy" compared to the indirect method (described directly above). Context bias can become a potential problem with the direct method. If the number of items grows to the point that the researcher wishes to show the items across multiple screens, then the context of the other items on the screen can affect the absolute judgments given.
Note: if you want to use the direct method and have each respondent rate only a subset of the items within the direct scaling questions, you should select a variety of items ranging from low utility to high utility for each respondent. One way to do that is by asking Lighthouse Studio to compute MaxDiff scores on-the-fly and by using the available Sawtooth Script functions for MaxDiff to build a constructed list of a subset of items based on the scores. For example, if 30 total items are in your study, you might use this procedure to have respondents rate in a grid question just seven of the items: those with on-the-fly rankings of 1, 5, 10, 15, 20, 25, and 30. Consider a MaxDiff exercise named MXD with 30 total items in predefined list MXDattributes (where each item was shown at least 2x or more to each respondent). Here is an example of the logic for building a constructed list containing the 1st, 5th, 10th, 15th, 25th, and 30th ranked (estimated using on-the-fly scoring) items for the individual:
ADD (MXDattributes, MaxDiffRankAttValue(MXD, 1))
ADD (MXDattributes, MaxDiffRankAttValue(MXD, 5))
ADD (MXDattributes, MaxDiffRankAttValue(MXD, 10))
ADD (MXDattributes, MaxDiffRankAttValue(MXD, 15))
ADD (MXDattributes, MaxDiffRankAttValue(MXD, 25))
ADD (MXDattributes, MaxDiffRankAttValue(MXD, 30))
The probability-scaled scores when using Anchored scaling are positive values where the Anchor is set to 100 and the largest possible value is the number of items shown to respondents in each set * 100.
The probability-scaled scores are developed as follows. Perform the following transformation on the raw results (where the anchor is zero for each person or class) for each item score for each respondent:
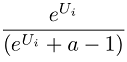
Where:
Ui = raw logit weight for item i.
e^Ui is equivalent to taking the antilog of Ui. In Excel, use the formula =EXP(Ui).
a = Number of items shown per set
The interpretation of this transformation is that we're computing the likelihood that each item would be selected as best from a set including that item and other items of equal utility to the Anchor threshold (where the set size is equal to that shown to respondents in the questionnaire).
At this point, the threshold value probability value is constant and equal to 1/a. Out of convenience, we set the threshold value equal to 100 by multiplying all scores by 100/(1/a).
One disadvantage of this scale is that each respondent does not receive equal weighting when computing population means. Respondents who believe all items fall below the threshold have a maximum score of 100, whereas respondents who believe some items exceed the Anchor utility have a maximum score of the number of items shown in each set * 100.
Zero-Anchored Interval Scores
If you have used Anchored MaxDiff, scores are displayed where the anchor threshold is set to 0. The zero-anchored interval scores are normalized to have a range of 100 utility points. Positive scores are associated with items judged above the anchor threshold; negative scores are associated with items judged below the anchor threshold.
Raw Scores
If you have used Anchored MaxDiff, scores are displayed where the anchor threshold is set to 0. The raw scores have logit scaling (the raw coefficients that result from using logit analysis and maximum likelihood estimation). Positive scores are associated with items judged above the anchor threshold; negative scores are associated with items judged below the anchor threshold.
Validation Research-on-Research for Anchored Scaling MaxDiff
Sawtooth Software and Kevin Lattery (from Maritz) have separately conducted a few research-on-research projects to test and validate different methods for anchored scaling in MaxDiff. To read more about different approaches to direct and indirect anchored scaling approaches, please see:
•"Using Calibration Questions to Obtain Absolute Scaling in MaxDiff" (Orme 2009)
•"Anchored Scaling in MaxDiff Using Dual-Response" (Orme 2009)