PowerPoint Report
Create PowerPoint Report
Clicking the Create PowerPoint Report opens the dialog box shown below. The intention is to create a starting point for you with statistics and data from the Simulations you've run, and allow you to fill in details and commentary appropriate to your intended audience.
This project had two Scenarios in it, each of which had a simulation run prior to going to Create PowerPoint Report. If a Scenario you want to include is not listed in this dialog, Close this dialog, go back to the Scenario tab and click the Simulate button, then come back here.
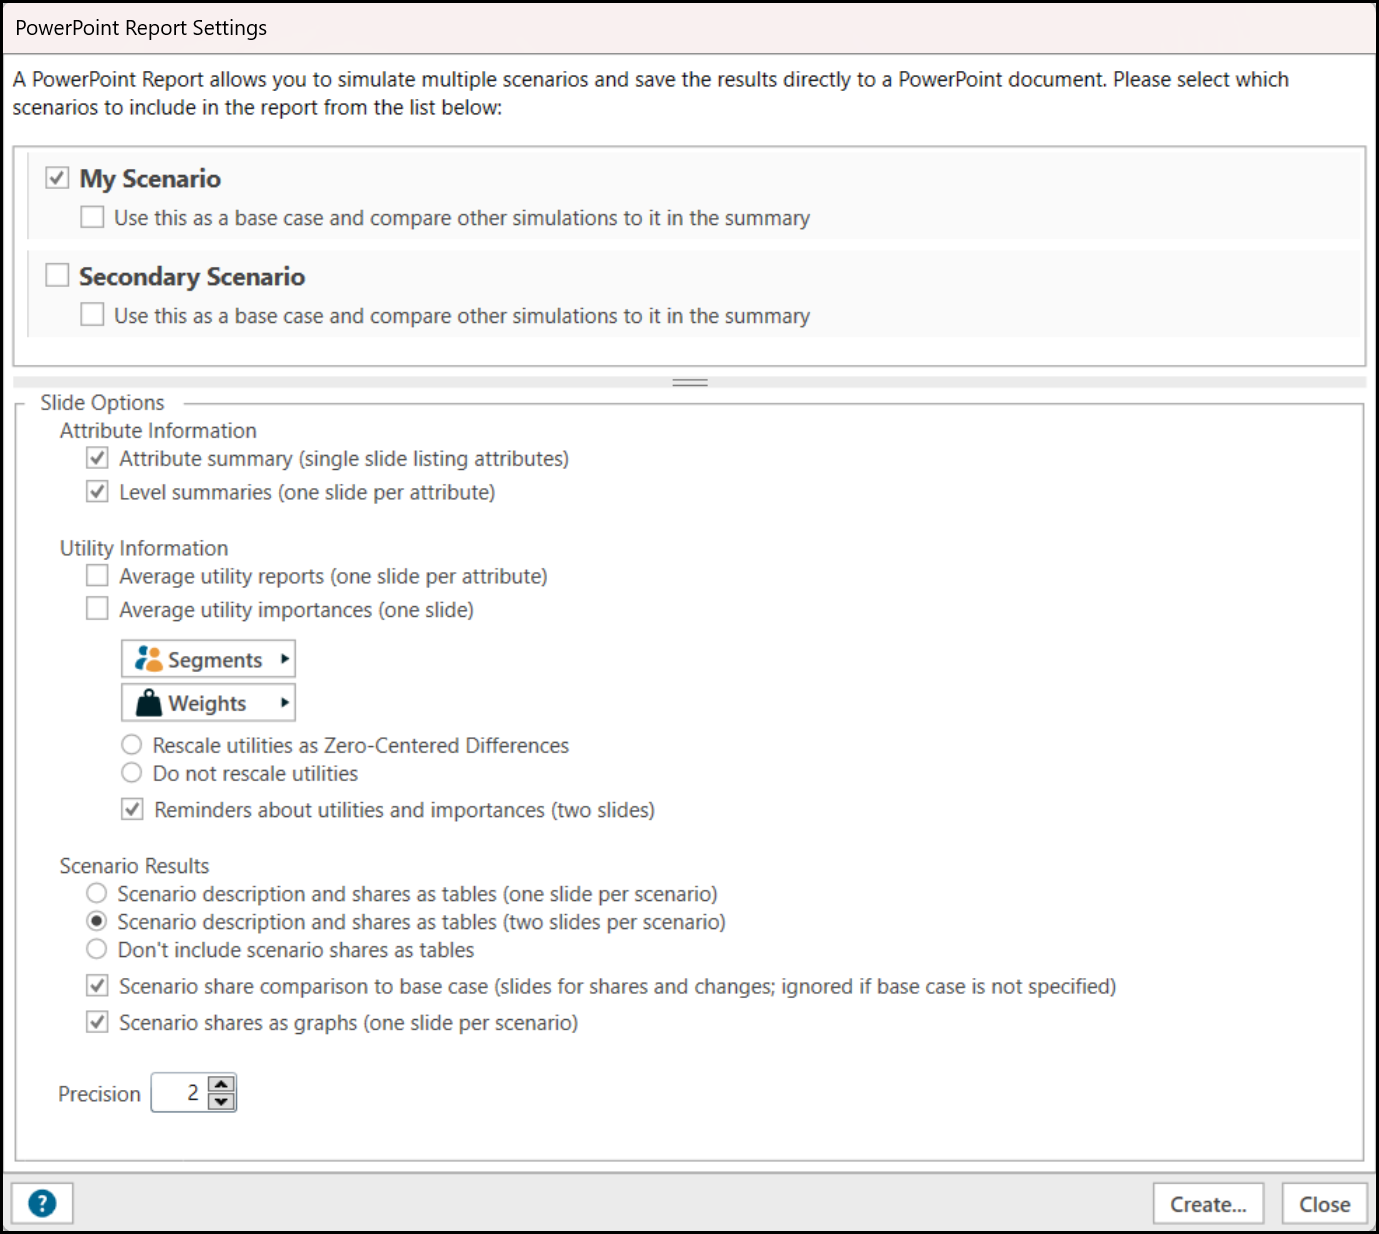
If you have selected multiple Scenarios to include in the presentation, you may also select one of the scenarios to be the Base Case reference scenario to which the others will be compared in the summary page.
Slide Options:
This section allows you to select from a number of pre-built Slides to be included in your PowerPoint slide deck.
Attribute Information:
Attribute summary: include a slide containing a list of the attribute labels, with a header.
Level summary: include slides containing the attribute label as a header, and a list of the attribute level labels.
Utility Information:
Average Utility Reports includes one slide per attribute with the average utilities for the Levels in that attribute.
Average Utility Importances includes a single slide with importances by Attribute.
Choosing Segments and Weights (in their respective lists) will affect how both Average Utility Reports and Average Utility Importance are displayed.
Rescaling Utilities as Zero-Centered Differences will results in some positive and some negative Utilities (that total to zero). Not Rescaling will leave all Utilities positive. This is a matter of preference.
You can also have two slides with information about how to Interpret Utilities included as part of this section.
Scenario Results:
This section has options for including information about the simulation results of each scenario.
You may select to include the scenario description and the results as either a single slide per scenario or as two slides (one for the description and another for the results). To not include Scenario description and shares as tables, select the "Don't include scenario shares as tables" option.
If a base case has been selected from the scenarios being included in the report, you have the option to include slides which will compare the base case to the other included scenarios. Finally you have the option to include slides where the results of the scenarios are presented as a bar chart.
Precision:
This value determines the number of decimal places of precision used when creating tables and charts.