Individual-Level Score Estimation
MaxDiff uses a sophisticated estimation technique to produce scores for each respondent on each item. You do not need to have any special training in statistics to consistently achieve good results. Item scores for each respondent may be saved to an Excel-compatible file. These scores are very easy to interpret and present to others.
The recommended statistical technique used to estimate scores for each respondent is called HB (hierarchical Bayes estimation). This is a well-documented and trusted advanced statistical technique in the market research industry. It is beyond the scope of this documentation to describe HB, but information is available in technical papers on Sawtooth Software's website at www.sawtoothsoftware.com.
MaxDiff questionnaires often provide too little information to stabilize scores for any one individual taken by itself. The HB estimation routine is able to stabilize the estimates for each individual by "borrowing" information from the body of respondents in the same data set. Therefore, by adding new respondents to the data (and re-computing results), the resulting scores for existing respondents will change a little. And, it helps to obtain stable results if a large pool of respondents is available for HB estimation. Typical sample sizes start at one hundred or more respondents, though most projects will probably involve from 300 to 1000 respondents.
If using HB analysis, it is also important that each respondent have provided enough data (relative to the number of items in your study) to stabilize the score estimates and to avoid overfitting. For recommendations regarding proper questionnaire length, see the section entitled Designing the Study.
Warning: Because the information from MaxDiff questionnaires is relatively "sparse," it requires a reasonable number of respondents to obtain stable results at the individual level. If you run the MaxDiff Scores procedure with tiny sample sizes (such as 10 or fewer respondents), you might see some unstable (and extreme) scores for individuals.
Settings and Options
When you click Analysis | Analysis Manager and specify HB as the Analysis Type, you can then click the settings button. The default settings should work well for almost every application, but we review them here.
Respondent ID
If estimating utilities using Latent Class or HB, you should select the Respondent ID to use for identifying the respondents in the utility files and segment membership files.
Respondent Filter
Filters allow you to perform analysis on a subset of the data. Categories of the sys_RespStatus (Incomplete, Disqualified, or Qualified/Complete) variable may be selected for inclusion in the analysis. Using the Manage Filters... additional filters may be selected from variables in your study, or new variables that you build based on existing variables or combinations of existing variables.
Sets to Include
Clicking Sets to Include area accesses a dialog in which you can specify which sets to include. Most users will utilize all sets within analysis. However, there may be instances in which advanced users wish to use only a subset of the full data.
Constraints
Sometimes you know beforehand that some levels rationally should be preferred to others. For example, perhaps you included three items in your list related to end-of-year bonus:
Receive a $500 end-of-year bonus
Receive a $750 end-of-year bonus
Receive a $1,000 end-of-year bonus
Every rational respondent should prefer higher bonus to lower bonus, and you can inform the estimation routine of this preference. Click the Constraints section if you would like to specify known preference orders and constrain the estimated scores to conform to these expectations. The method that MaxDiff uses to constrain the scores is called "simultaneous tying" and it is described in the CBC/HB Technical Paper on our website.
Anchored Scaling
If you included Indirect Dual-Response Anchored Scaling questions within your MaxDiff questionnaire, you can use the anchor information within score estimation by clicking the Include Dual-Response Indirect Answers in Analysis checkbox. Unchecking this box means that scores are estimated in the standard way, without considering the answers to the Indirect Anchored Scaling questions and without estimating the scores relative to an anchor.
To use the Direct Binary Approach, click the Use Direct Binary Approach checkbox. You must have collected additional information outside the MaxDiff questions regarding how each item (or each of a subset of items) relates to the anchor (importance threshold). A dialog opens up with a row for each item in your MaxDiff study. Specify the logic for each item that was rated or ranked relative to the anchor threshold.
Examples:
•If you used a 2-point ratings question within a grid question called ImpItems to rate each of the items, then item 1 would exceed the anchor threshold if ImpItems_r1 > 1. ( _r1 stores the rating for the first row within a ratings grid.) If a respondent has missing data on the scaling question for an item, then no information is added for utility estimation regarding this item relative to the anchor for this respondent.
•If you used a multi-select checkbox called ImpItems, where respondents clicked which items on the list exceed the anchor threshold, then item 1 would exceed the anchor threshold if ImpItems_1=True. ( _1 stores the selection for the first item within a multi-select question.) If a respondent has missing data on the item (e.g., the item was not included on the constructed list), then no information is added for utility estimation regarding this missing item relative to the anchor for this respondent.
Advanced | Covariates
Covariates are variables outside the MaxDiff responses such as respondent classifications (small company, large company, high income, low income, etc.) or continuous variables (household income, preference score on variable x, etc.) that might be useful to leverage within HB estimation. Without covariates, population mean item scores (for respondents included in analysis) are referenced when estimating the scores for each respondent. When using covariates, cohort-specific mean scores are referenced. This holds the potential benefit that respondents "borrow" information primarily within their cohort rather than generally across the sample. Using covariates tends to slow the computation speed, and too many covariates may cause your system to grind to a near halt. Although the use of covariates seems to offer promise for better utility scores, many research papers have reported that covariates do little to nothing to improve the predictive validity of the scores. Even so, discrimination between respondent groups (especially on the dimensions of the covariates) does increase with the application of covariates.
If you click Settings... and then click the Settings category at the left of the subsequent dialog you can review (or modify) the settings that will be used in your score computation. We'd like to emphasize that most users will not need to investigate this area. (For more information about the controls used in this area, please refer to the CBC/HB Technical Paper, available for downloading from our website in the technical papers library).
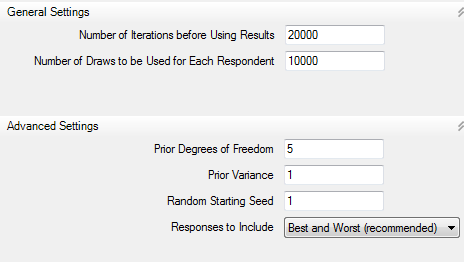
Number of Iterations before Using Results
The estimation routine that MaxDiff employs (HB) uses many thousands of iterations to find stable scores prior to actually "using" (saving) the results for each respondent. 20,000 iterations is the default, and should give you a healthy margin of safety, in the sense that the scores should have every opportunity to stabilize (assuming appropriate design and sample size). You may change the number of iterations if you wish.
Number of Draws to Be Used for Each Respondent
Each iteration that HB completes results in an estimate of each respondent's scores called a "draw." From one draw to the next, the scores can vary by a random perturbation. One could plot the distribution over many draws and we'd generally find that the draws are distributed normally. MaxDiff averages these draws for each respondent across as many draws as indicated in this field, and reports that average as the final raw score for each item. Theoretically, the more draws used per respondent, the more precise the estimates. However, you will find that 10,000 draws already provides a high degree of precision.
Prior Degrees of Freedom
This value is the additional degrees of freedom for the prior covariance matrix (not including the # parameters to be estimated), and can be set from 2 to 100000. The higher the value, the greater the influence of the prior variance and more data are needed to change that prior. The scaling for degrees of freedom is relative to the sample size. If you use 50 and you only have 100 subjects, then the prior will have a big impact on the results. If you have 1000 subjects, you will get about the same result if you use a prior of 5 or 50. As an example of an extreme case, with 100 respondents and a prior variance of 0.1 with prior degrees of freedom set to the number of parameters estimated plus 50, each respondent's resulting scores will vary relatively little from the population means. We urge users to be careful when setting the prior degrees of freedom, as large values (relative to sample size) can make the prior exert considerable influence on the results.
Prior Variance
The default is 1 for the prior variance for each raw score, but users can modify this value. You can specify any value from 0.1 to 100. Increasing the prior variance tends to place more weight on fitting each individual's data, and places less emphasis on "borrowing" information from the population parameters. The resulting posterior estimates are relatively insensitive to the prior variance, except 1) when there is very little information available within the unit of analysis relative to the number of estimated parameters, and 2) the prior degrees of freedom for the covariance matrix (described above) is relatively large.
Random Starting Seed
Any computer algorithm that uses random numbers needs a starting "seed" value. You may set this as an integer from 0 to 32000. When using different random seeds, the final scores will vary, but insignificantly, assuming convergence has been reached and many draws have been used. If you specify a "0," this uses the system's clock as the starting seed. If you want to be able to repeat results and achieve the same answer, then you should use a specific integer greater than 0.
Responses to Include
If you asked MaxDiff questions that included both a selection of "best" and "worst," you can select which response types to use in analysis. Researchers have noted that there can be statistically significant differences in scores developed from bests versus worsts. This control lets you investigate these issues if you'd like, including the ability to use answers from bests only in computing item scores.
The Computation Run
When you click Analysis | Analysis Manager select HB as the Analysis Type and then click Run, a simple dialog is displayed. The data are prepared and you are shown a summary report of the number of respondents included in the run:
** Data Summary **
Total respondents = 300
Total 'Best' choices = 4500
Total 'Worst' choices = 4500
Average sets per respondent = 15.0
'Best' responses by position:
(1) 25.64%
(2) 25.35%
(3) 24.89%
(4) 24.12%
'Worst' responses by position:
(1) 24.34%
(2) 24.68%
(3) 25.25%
(4) 25.73%
Click the Estimate Scores button to proceed with HB estimation. Depending on the size of your data set, it can take between fifteen minutes to a few hours or more to run. HB uses an iterative method that requires many thousands of iterations to stabilize and complete the run. We have chosen defaults to govern the HB run that should work well for most every situation. Advanced users can modify the settings if they desire.
While HB runs, a graphic is shown that characterizes how well the estimated scores are stabilizing over the planned thousands of iterations. The graphic plots the estimated scores at each iteration of the process. The estimates first all start at 0, and then trend toward their final values. Once the process has "converged" the estimates will tend to randomly "wobble" up and down, but there should be no noticeable trend remaining. Below is an example:
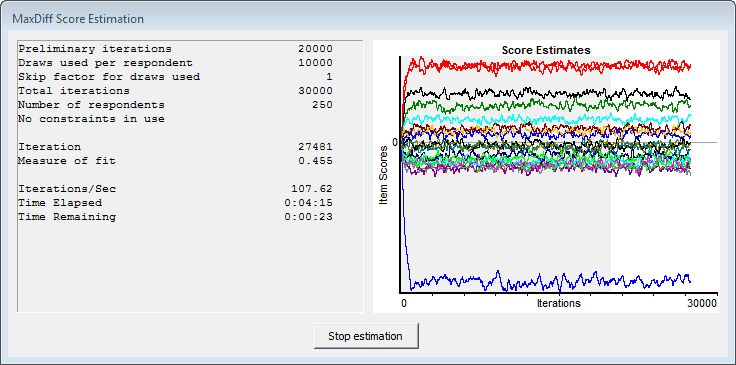
The graphic is divided into two regions: a gray region (iterations prior to assumed convergence) and a white region (iterations after assumed convergence). Once the iterations cross into the white region, you should look for no noticeable trend in the data. The plotted scores should just continue to wobble randomly up and down, with no strong and sustained move in any specific direction. The smaller the sample size or the more items included, the larger the wobble. If there is noticeable trend after the plotted values are in the white region of the graphic, then you can repeat the analysis using more iterations.
When the estimation finishes, the graphical plot of the estimation remains on the screen. Click the button stating: The estimation is complete. Click here to close.
When you click the "close" button, a report is given which resembles a spreadsheet, with multiple "sheets" that can be accessed by clicking the tabs at the bottom of the dialog labeled "Summary," "Settings Summary," "Probability Scale," "Zero-Anchored Interval Scale," and "Zero-Centered Raw Scores". The first (Summary) sheet contains a summary of the final scores, upper and lower 95% confidence bounds, as well as other information regarding the settings for your run. The third through fifth sheets (Probability Scale, Zero-Anchored Interval, and Zero-Centered Raw) contain the scores for each respondent (presented in two different formats), including a fit statistic for each respondent.
Probability Scale These individual-level item scores are positive values summing to 100 that reflect the likelihood of items being chosen within the questionnaire (unless you are using Anchored MaxDiff, where the probability scores are scaled differently). Most researchers will probably use this scaling procedure, as it is easiest to interpret and present to others. This approach has the valuable property of ratio-scaling. That is to say, an item with a score of 20 is twice as important (or preferred) as an item with a score of 10. Click here for more details regarding the rescaling procedure.
Zero-Anchored Interval Scale The scores are normalized to have a range of 100 utility points for each respondent and to sum to zero. These weights are on an interval scale, which does not support ratio operations. In other words, you cannot state that an item with a score of 20 is twice as important (or preferred) as an item with a score of 10.
If you have used Anchored MaxDiff, the anchor threshold is set to 0 for each respondent. Positive scores are associated with items judged above the anchor threshold; negative scores are associated with items judged below the anchor threshold.
Zero-Centered Raw Scores These are weights that directly follow from the MNL (multinomial logit) procedure employed within the HB engine. The items can have positive or negative weights and are zero-centered (the "average" item has a weight of 0). These weights are on an interval scale, which does not support ratio operations. In other words, you cannot state that an item with a score of 2.0 is twice as important (or preferred) as an item with a score of 1.0.
Click the Save Report button to save this report in Excel format.
(Note: the rank-order position of items based on average scores can differ between the raw and rescaled reports. However, the changes in rank-order position are seen generally when there is little absolute difference in scores between adjacent items. The overall interpretation of the results and main conclusions should not differ whether using the raw or rescaled reports.)