Registration open for the May 2026 Sawtooth Research Conference in Berlin!Register Now
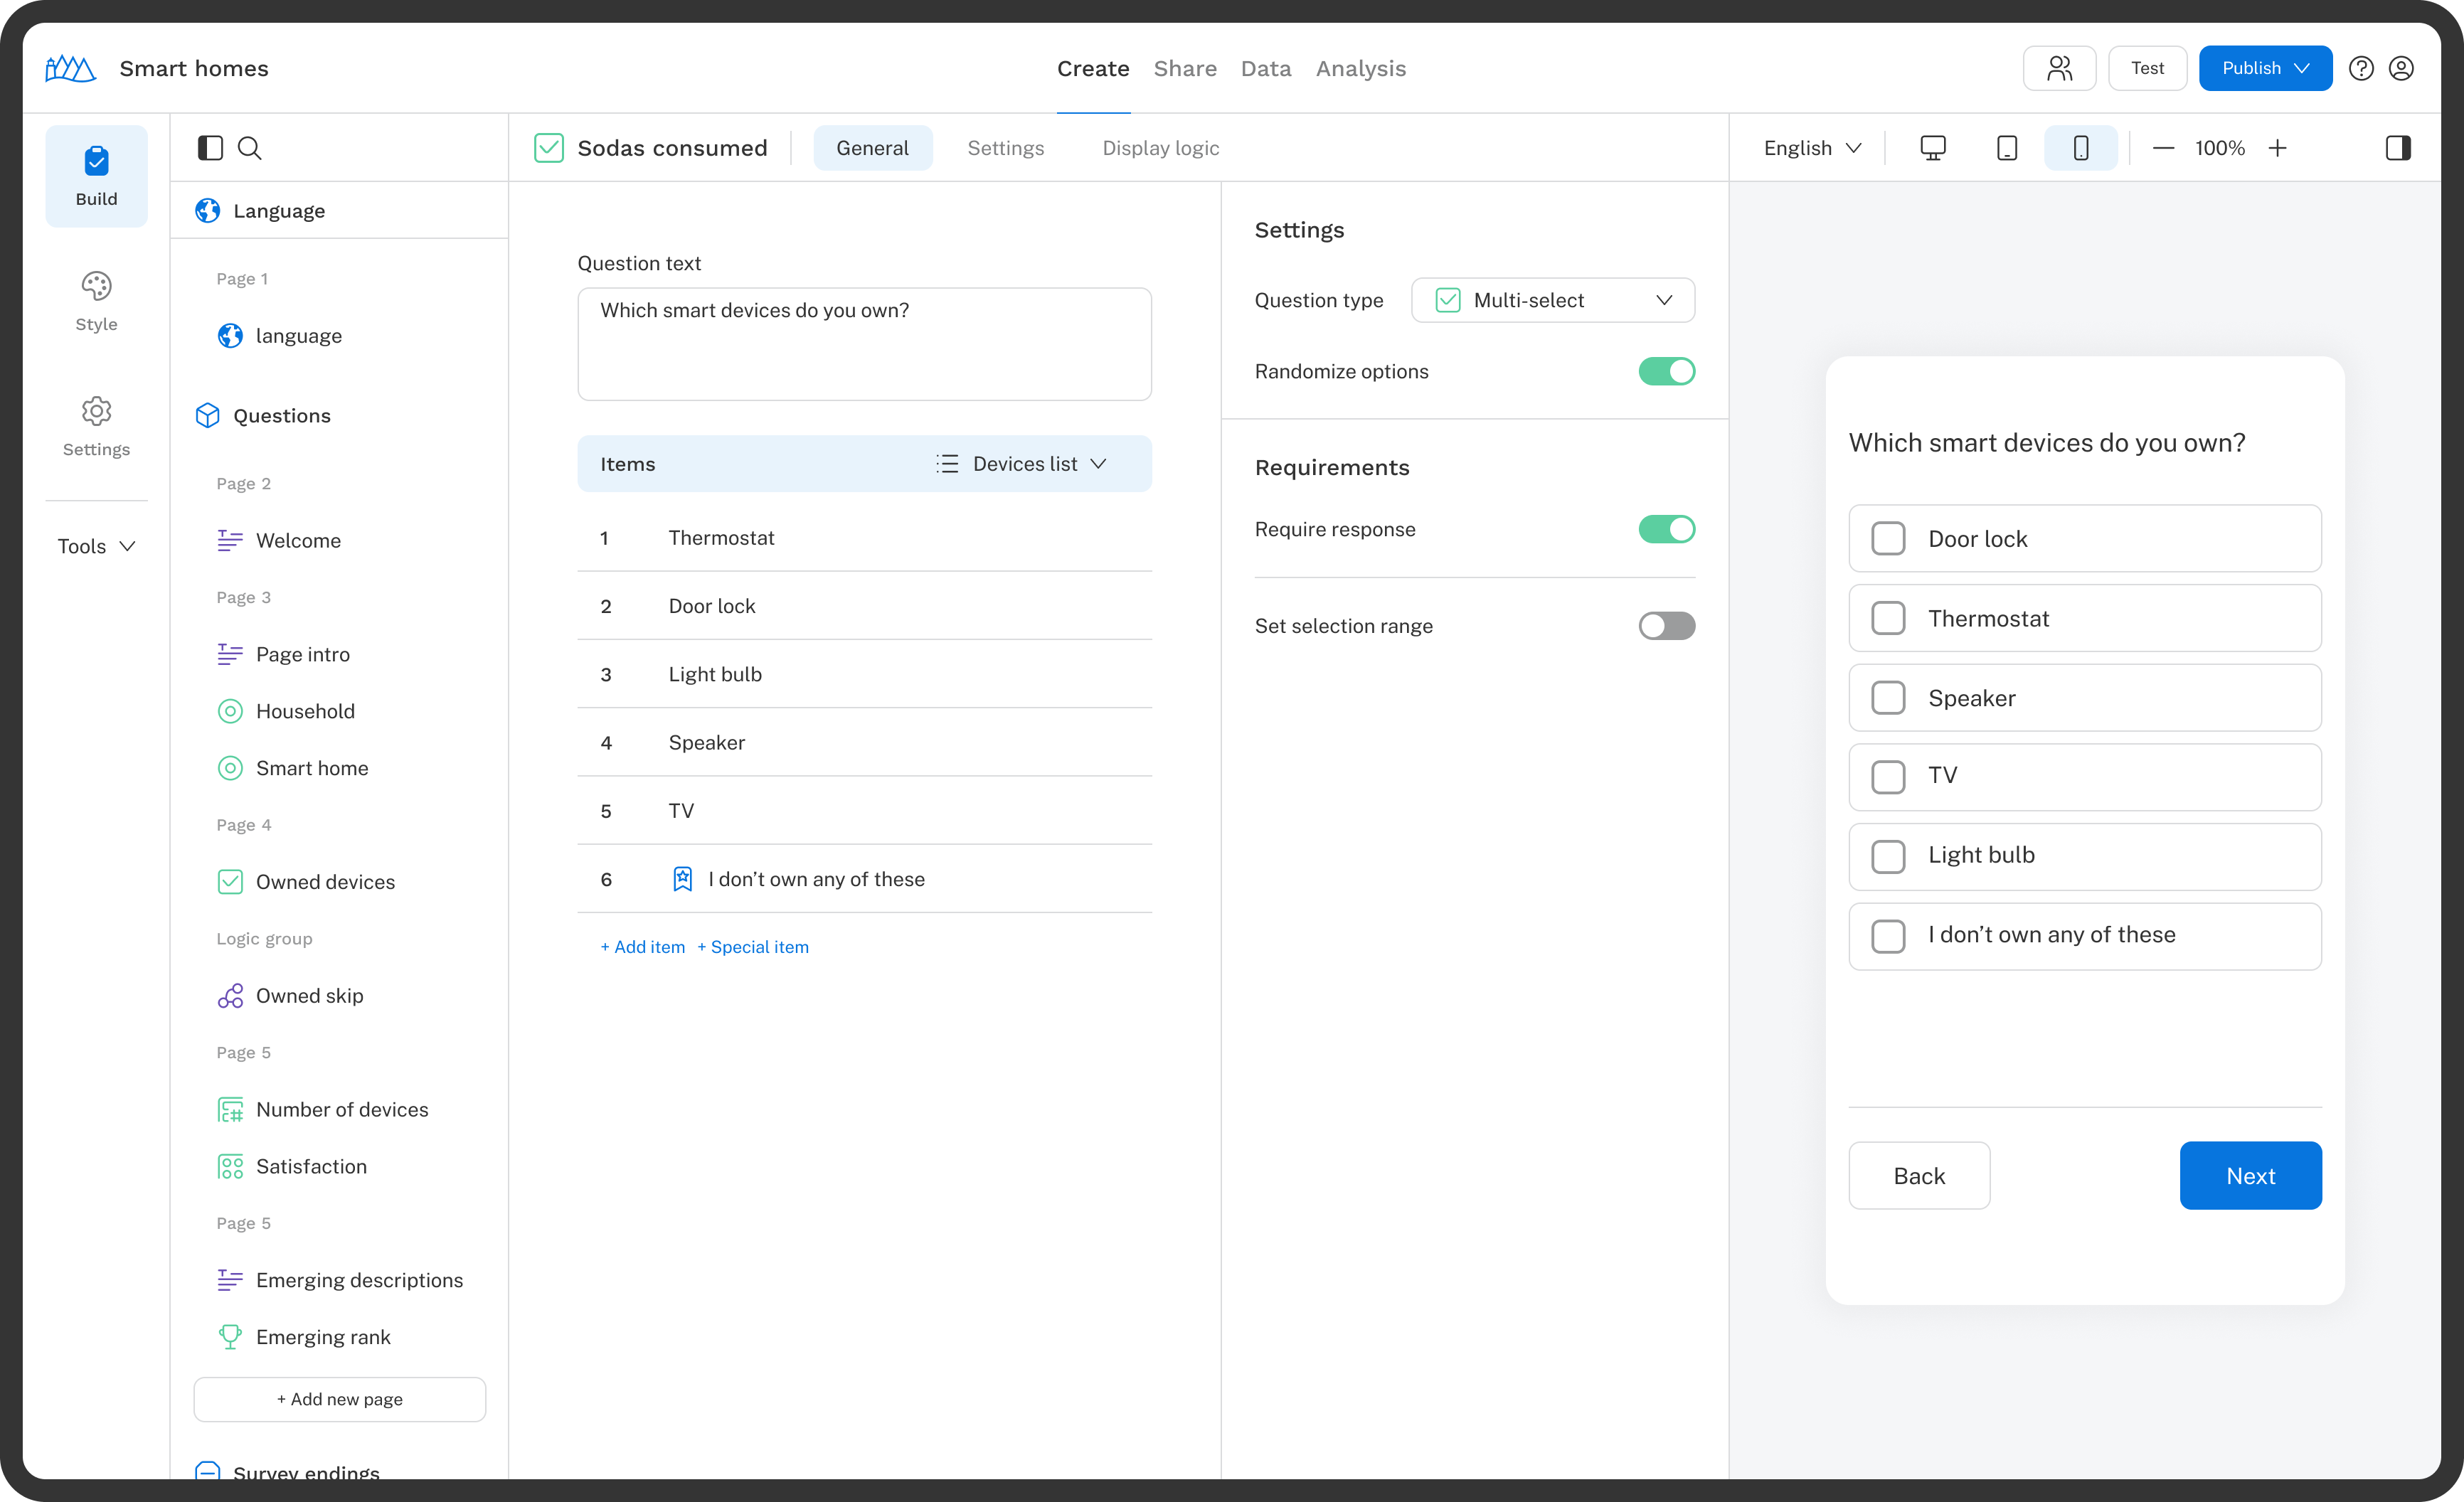
Explore the features of Discover and become an expert survey creator!
Sawtooth Software
3210 N Canyon Rd Ste 202
Provo UT 84604-6508
United States of America
Support: support@sawtooth.com
Consulting: consulting@sawtooth.com
Sales: sales@sawtooth.com
Products & Services
Support & Resources
Company