It's important to be mindful of how summary data is displayed, particularly when using non-mutually exclusive variables such as:
- Multi-select questions
- Multi-select grid rows
- Quotas with multiple group assignments
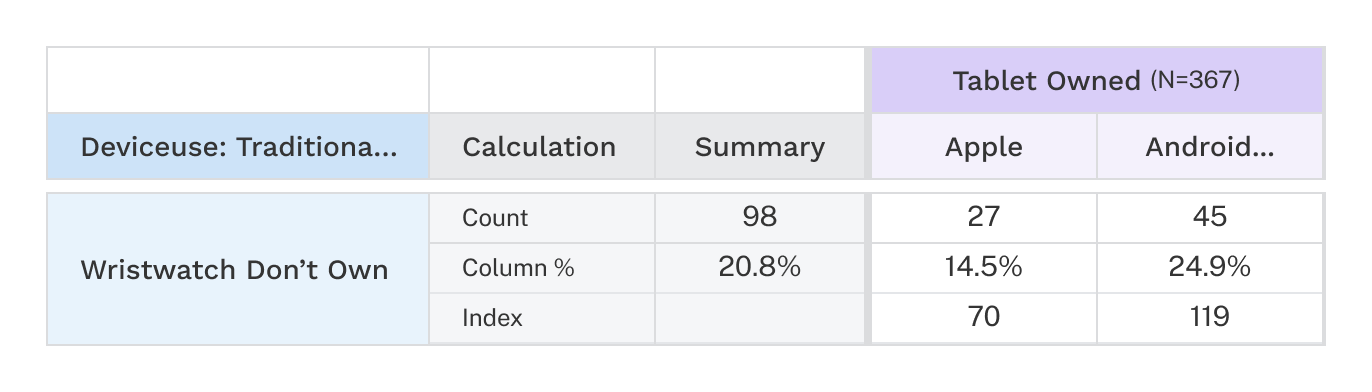
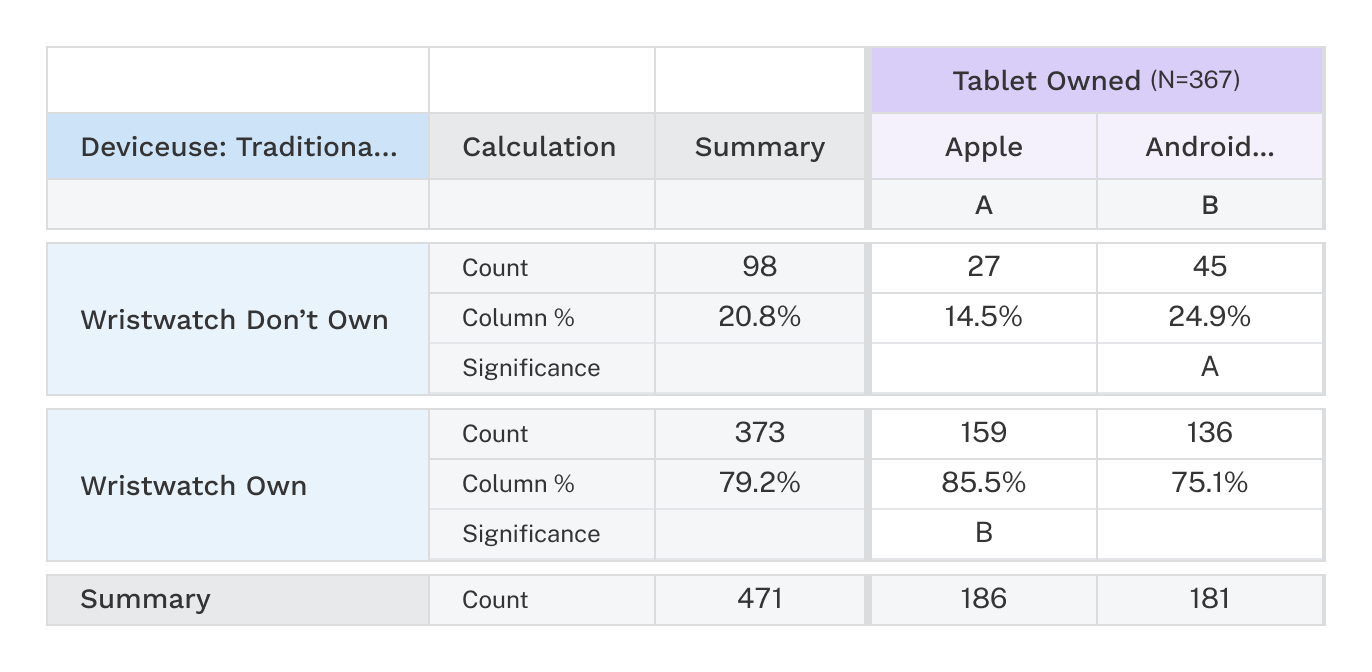
In these cases, the summary count cells will often not equal the sum of individual counts in a row or column, leading to confusion.
Example
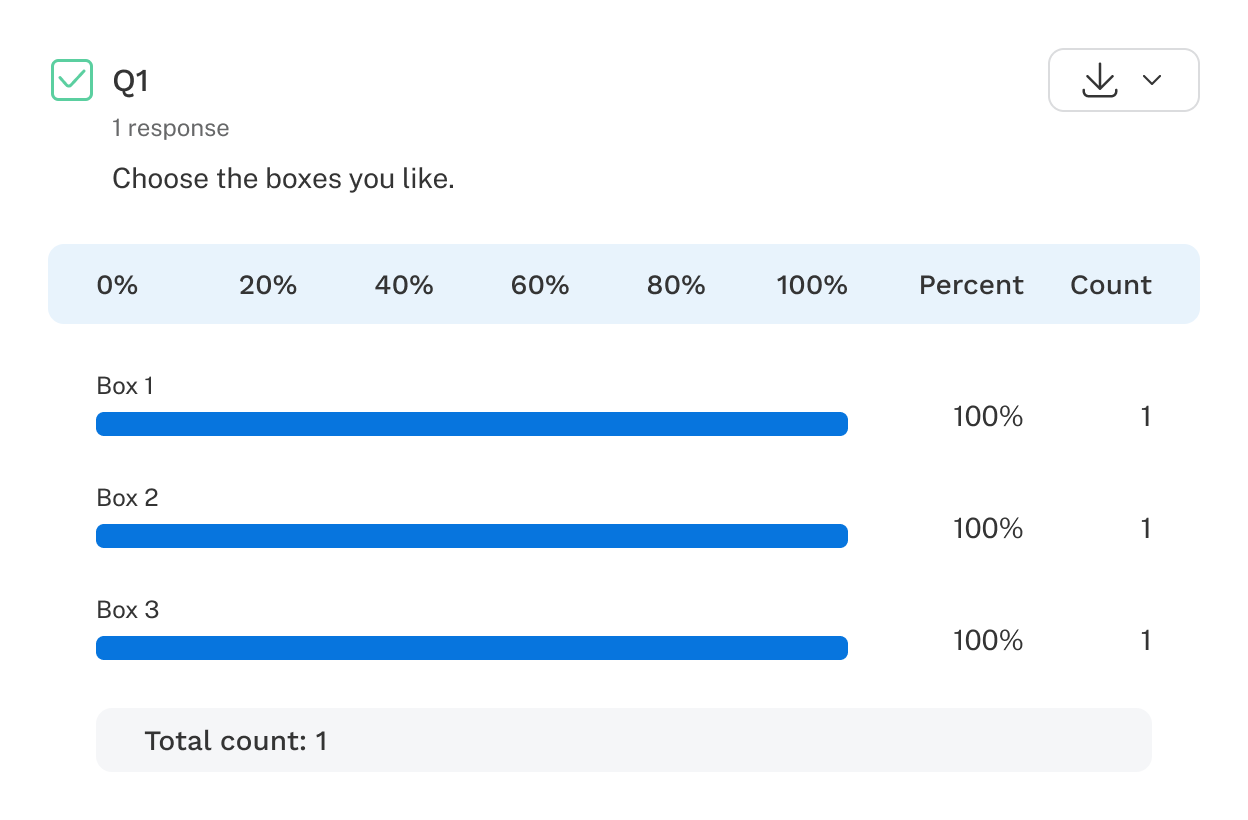
Here's what the analysis would look like for a respondent who checked all three boxes of a multi-select question:
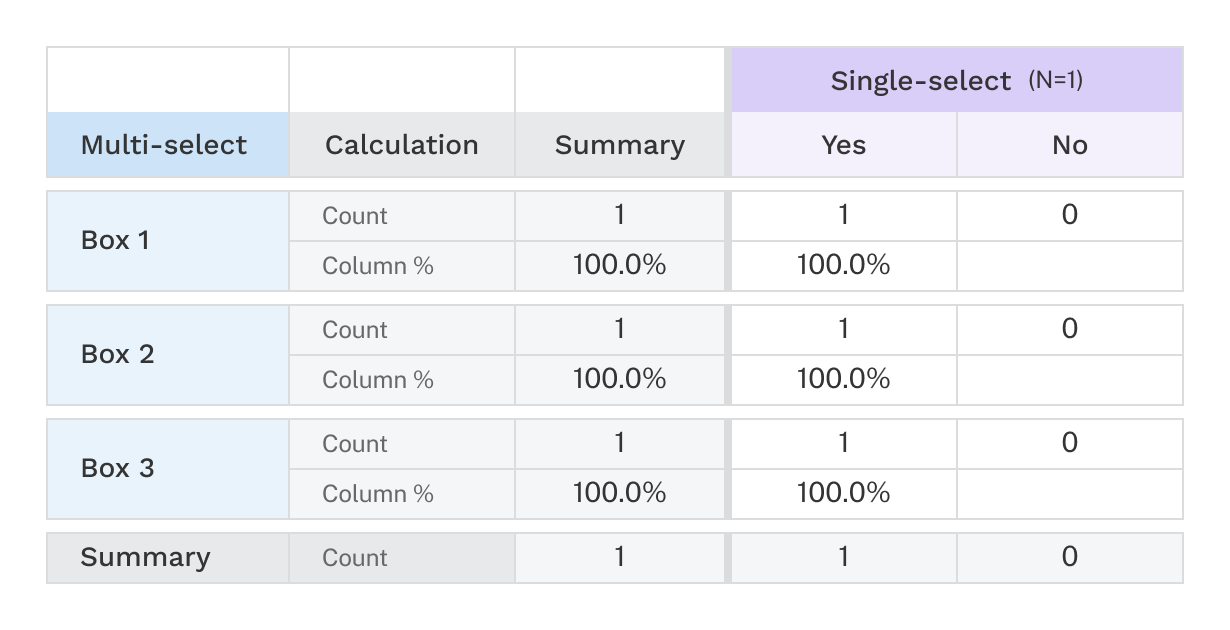
If you take that question and cross it with a mutually exclusive variable, such as a single-select question, you'll see the disconnect in counts, as shown in this crosstab example:
Summary counts represent the number of distinct respondents in a given row or column, ensuring the percentages remain meaningful. Since respondents can fall into multiple categories, a direct summation would double-count respondents, leading to misleading row and column percentages.
Crosstab counts vs. other analysis areas
Summary counts in crosstabs may not always match the respondent N values found in other reports. This discrepancy arises because crosstab values are specific to the report being generated.
For instance, the N value in a quota report (which can be viewed in Data > Summary) includes all respondents who passed through the quota, regardless of whether they were assigned to any groups due to the application of group logic. In contrast, only respondents assigned to a group will be displayed in a crosstab based on the quota.
If a column question (banner) has more respondents than a row question (stub), those who answered the column question but not the row question will not appear in the crosstab.
Crosstab reports exclude respondents that are irrelevant to the displayed rows and columns. This is why summary counts may not always align with N values in other reports. If a respondent did not qualify for any category being analyzed in the crosstab, they will not show up in the summary counts, even if they are included in a broader analysis elsewhere.
Understanding these nuances allows you to interpret crosstab summaries more accurately and avoid misinterpreting data distributions.